Introducing Team Performance Dashboard

It is Wednesday afternoon. A recruitment manager wants to know how the week is going.
So the messages go out. "How many profiles did we send to the bank today?" "Did anyone move candidates on the Hyderabad role?" "Where are we this week?" The answers trickle in over the next hour, each one a little different in format, and a few never arrive at all. By the time the weekly report lands on Friday, the week is already over.
Nobody here is doing anything wrong. The recruiters are busy working. The manager is doing their job. The problem is that the answers to the most basic management questions live inside everyone's day, and there has been no single place to see them.
That is the gap the Team Performance Dashboard is built to close.
The questions it answers
Every recruitment manager we work with asks some version of the same four questions:
- How many candidates did my team move today?
- Which recruiter is doing well this week?
- Which recruiter is slow this week?
- How many profiles did we send to clients?
Earlier, answering them meant pulling a report or asking each recruiter. Now you open one tab and the answers are already there, for today, this week and this month.

Where to find it: log in to Hirewand, go to your home screen, and click the Team performance tab. That's it.
Three views, for three rhythms of management
Managing a team happens at different speeds. Some calls need to be made before lunch. Some need a few days of pattern. Some only make sense across a month. The dashboard gives you a view for each.
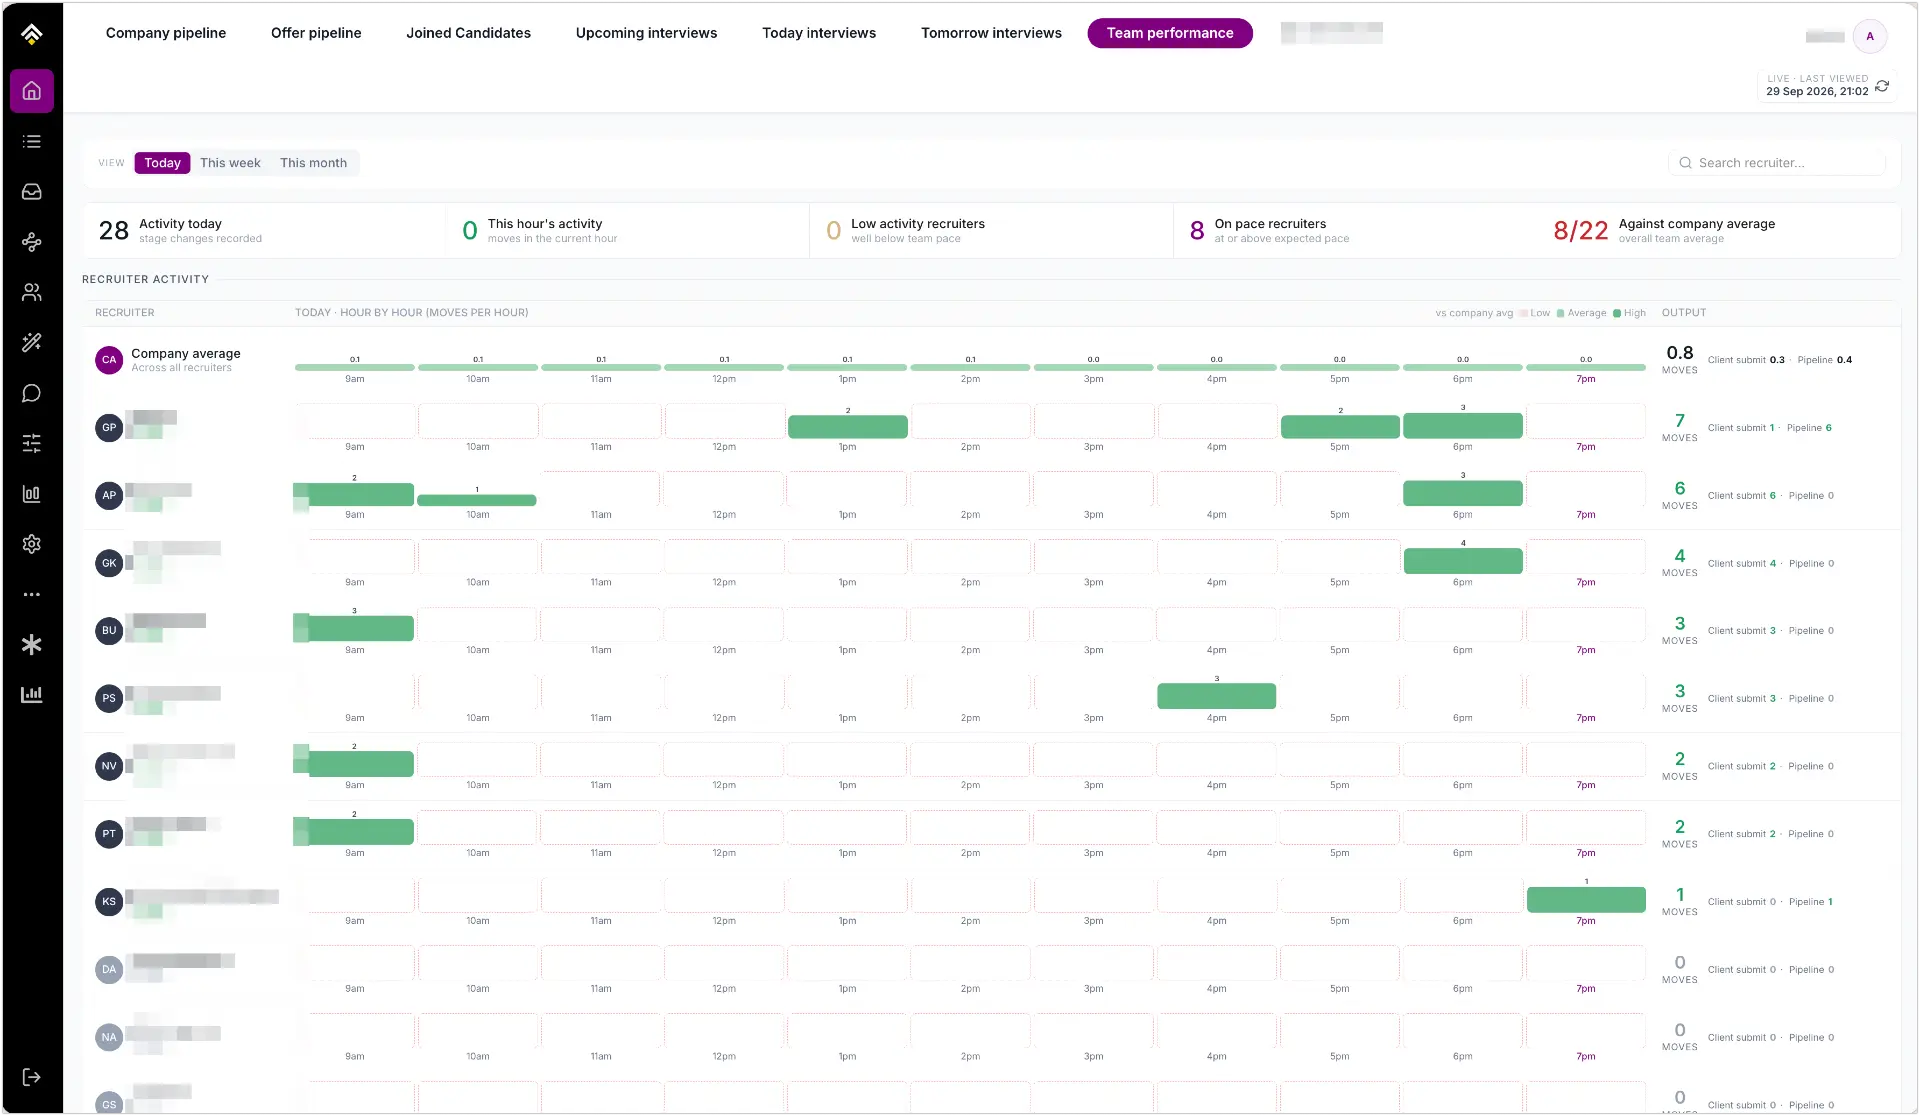
Today shows each recruiter's work hour by hour, across the working day from 9 am to 7 pm. You can see when each person was active, and where the quiet hours were. This is the view for acting on the same day.
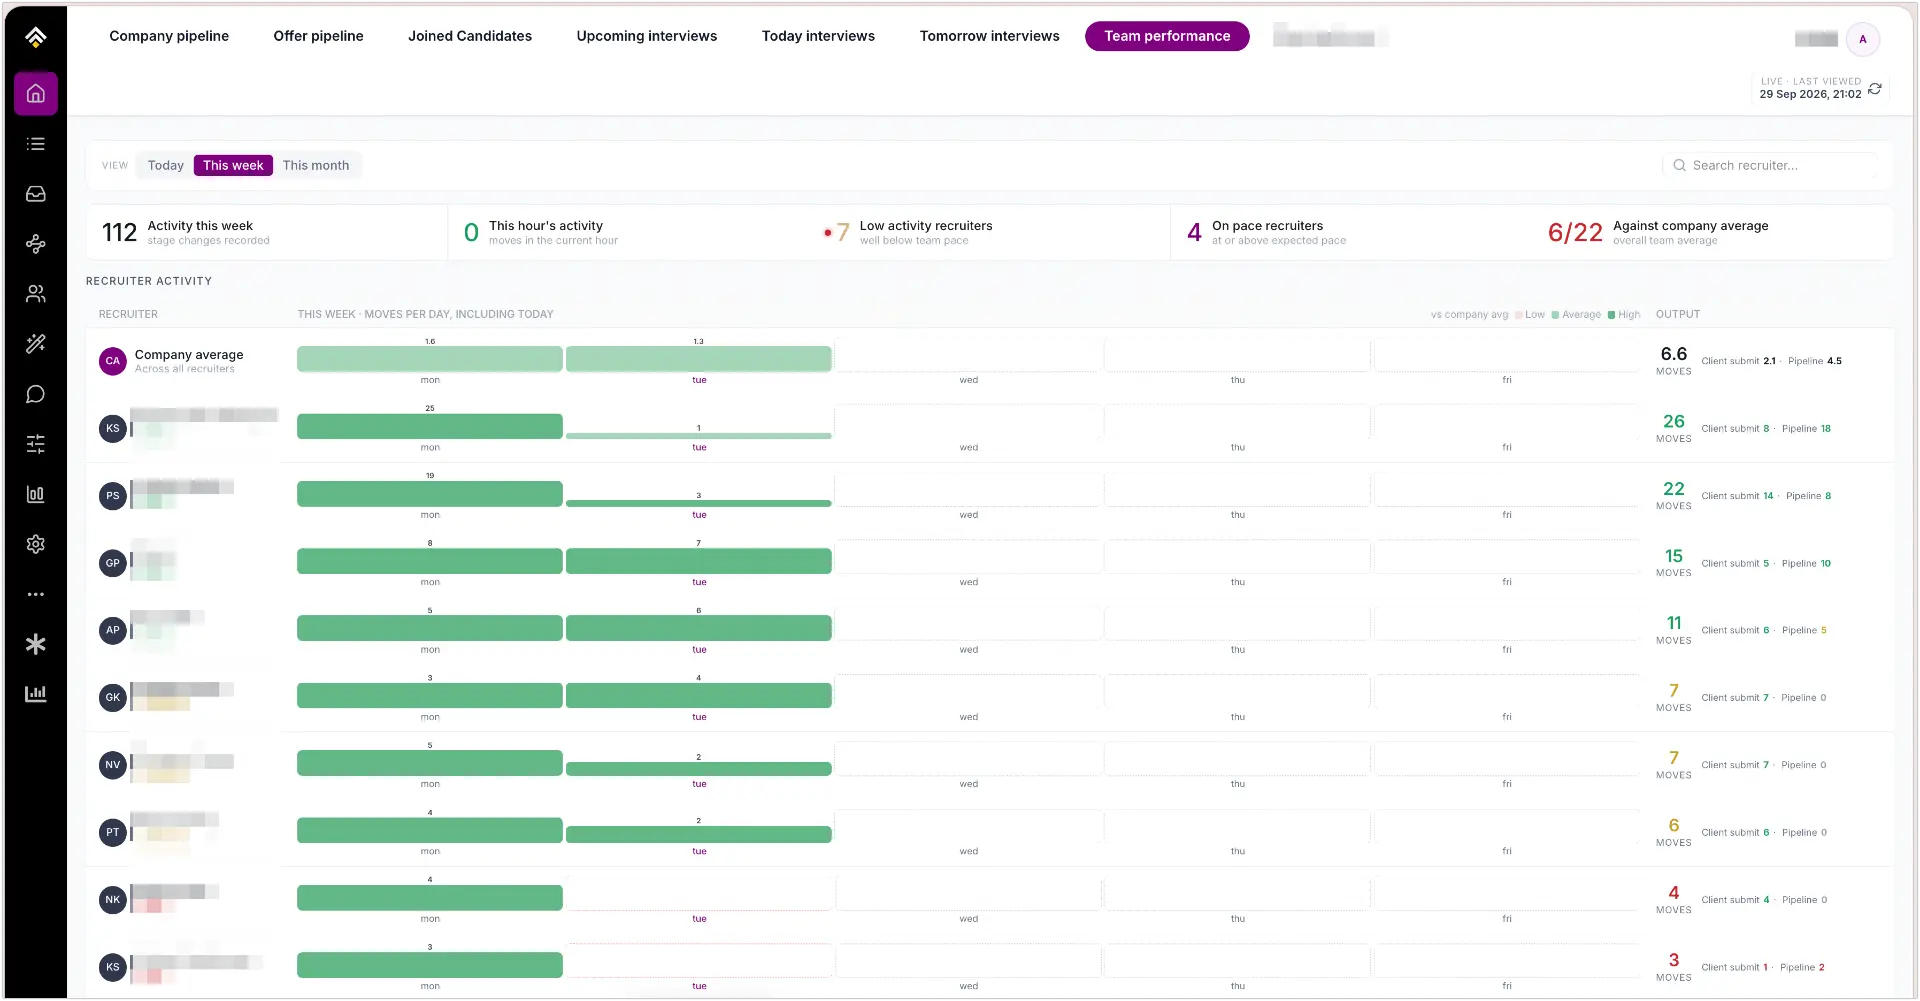
This week shows each recruiter's work day by day, Monday to Friday. If the team is slow on Monday or Tuesday, you will know early, while there is still time to fix it before the week ends.
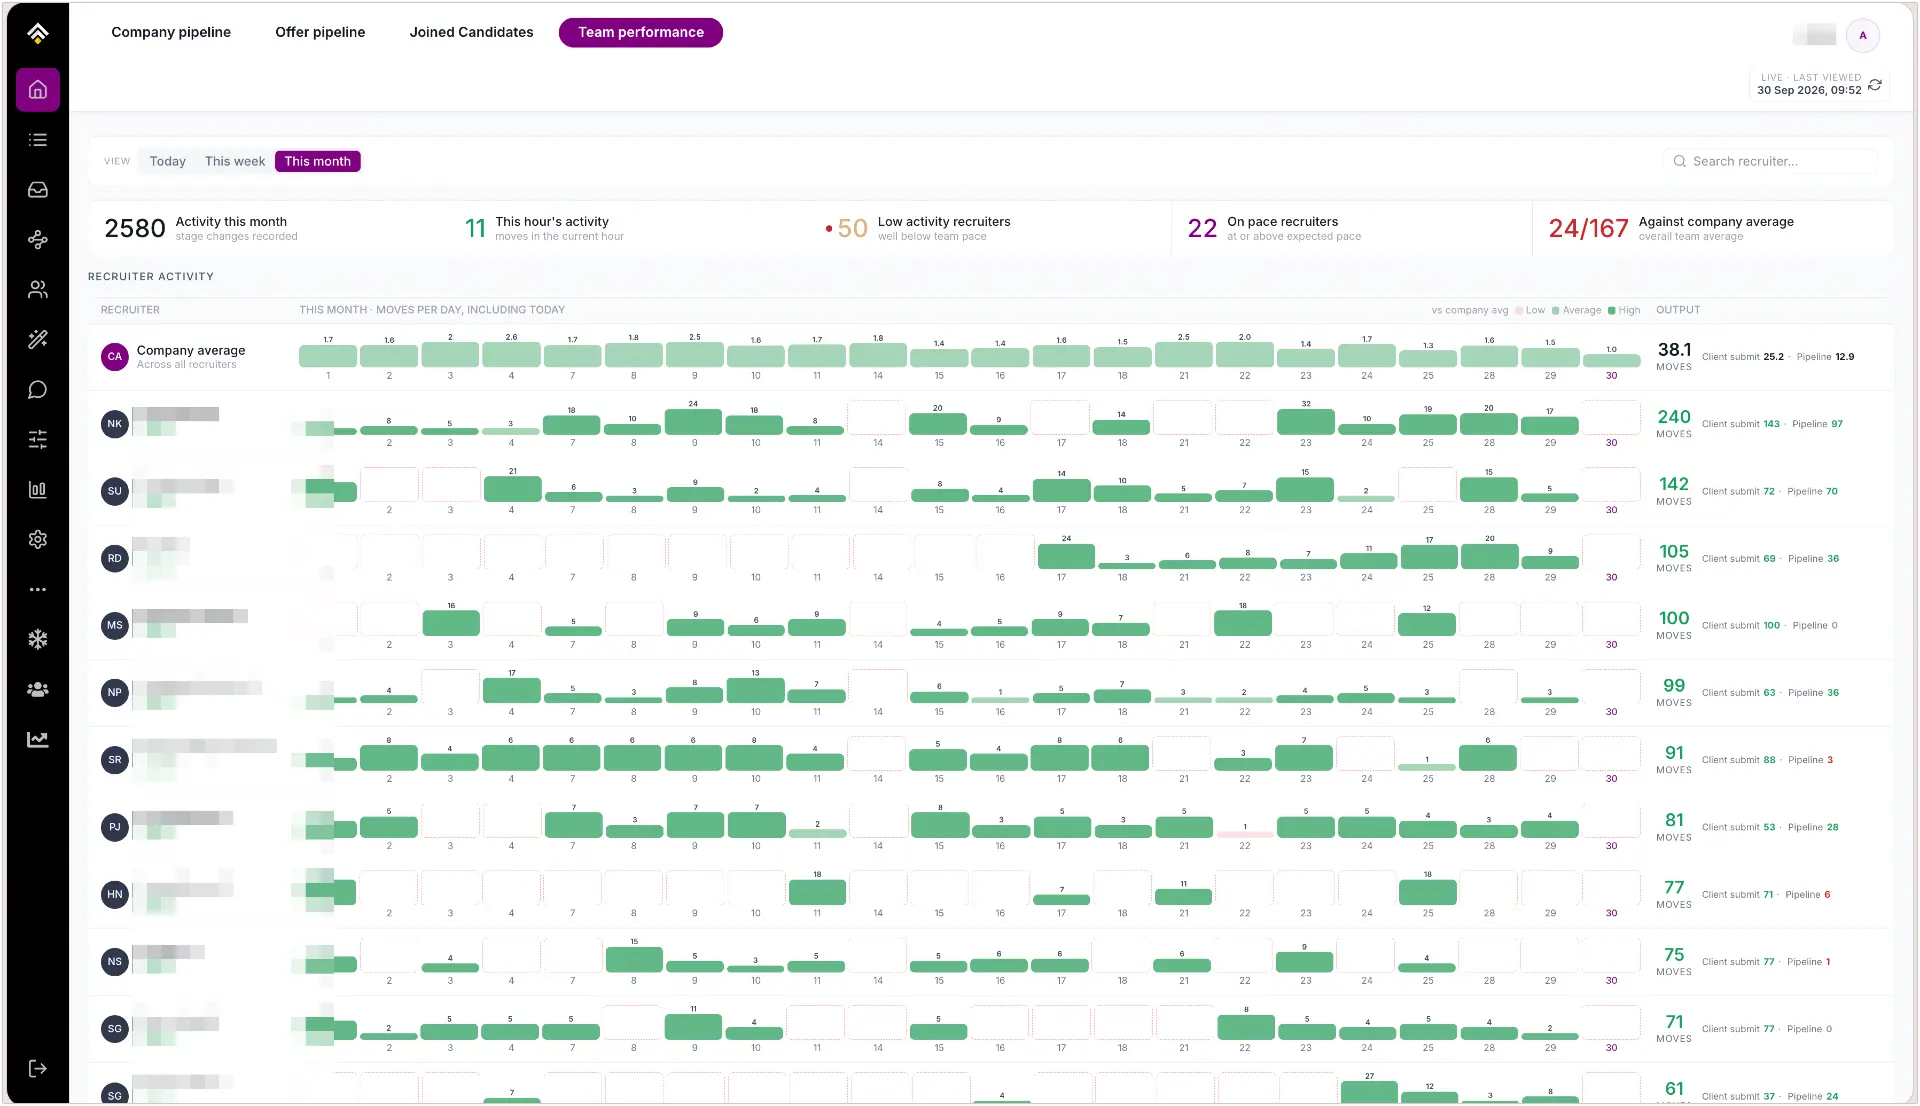
This month shows each recruiter's work for every day of the month. You can see who works steadily every day, and who has good days and slow days. This is the view for monthly reviews.
Five numbers that give you the pulse of the team
Before you look at a single recruiter, the top of the page gives you the shape of the whole team in five numbers:
| Number | What it tells you |
|---|---|
| Total activity | The total number of candidate stage changes made by your team in the selected period |
| This hour's activity | How many moves your team has made in the current hour |
| Low activity recruiters | How many recruiters are working well below the team's pace |
| On pace recruiters | How many recruiters are at or above the expected pace |
| Against company average | How many recruiters are doing better than your company's average |

Five seconds with this row usually tells you whether today is a normal day or one that needs your attention.
The company average: a benchmark built from your own team
The first row on the dashboard is not a recruiter. It is your company average: the average work done across all your recruiters.
This matters more than it looks. Industry benchmarks rarely fit the way a specific team works, the roles it hires for, or the clients it serves. Your own average does. Every recruiter on the dashboard is compared against the team they actually work in, not an abstract target.
A row for every recruiter
Below the company average, every recruiter has their own row. Each row shows:
- Total moves: how many candidates the recruiter moved from one stage to another
- Client submits: how many candidate profiles the recruiter sent to clients
- Pipeline activity: other stage moves inside your pipeline, such as screening and shortlisting
- A performance tag: High, Average, Low or None, showing how the recruiter compares with the company average
- Coloured bars: one bar for each hour or day. A darker green bar means higher activity. A light or pink bar means low activity. An empty box means no activity.
The bars are the part most managers end up reading first. A row of steady green tells one story. A row of bright starts and empty afternoons tells another. You can understand a recruiter's pattern in a few seconds, without reading a single number.
Working with a large team? Use the search bar at the top right to type a recruiter's name and go straight to their row. And the dashboard updates in real time, so you are always looking at the latest numbers. There is also a refresh button if you want to be sure.
How teams are planning to use it
We asked the managers who saw it first how it would fit into their week. Here is what they told us.
- Start the day with it. Open the Today view in the morning meeting. See who did well yesterday, and who may need support today.
- Check in mid-week. Open the This week view on Tuesday or Wednesday. If activity is low, talk to the team early, while there is still time to catch up.
- Use it in monthly reviews. Open the This month view before one-on-one meetings, and talk about real numbers, not guesses.
- Recognise top performers. It is easy to see who is working hard. Appreciate them in front of the team.
- Coach the right people. Some recruiters show high pipeline activity but few client submits. They are working hard, but profiles are not reaching clients. They may need help with screening or matching, and the dashboard helps you spot it.
- Balance the workload. If some recruiters are always busy and others are not, you can share the work better.
The fifth one is worth pausing on. A simple activity count would rank that recruiter near the top. Splitting activity into pipeline moves and client submits shows something more useful: effort that is not yet turning into output. That is a coaching conversation, not a performance problem, and it is much easier to have early.
What it does not tell you
The dashboard counts what happens inside Hirewand: candidates moving between stages and profiles going to clients. It is a clear picture of pipeline work, not the whole of a recruiter's day.
A recruiter on a long client call, sitting in on interviews, or working a difficult offer may show a quiet hour that was anything but quiet. A low bar is a reason to ask a question, not an answer in itself. Used that way, the dashboard does not replace the conversation between a manager and their team. It makes sure the conversation starts from the same facts.
Getting started
There is nothing to set up. The Team Performance Dashboard is already live, and it reads the activity your team already records in Hirewand. Log in and click Team performance.
New to Hirewand? Set up a 30-minute walkthrough to understand what Hirewand can solve for teams such as yours.
What's coming next
We will keep improving the Team Performance Dashboard, with more intelligent filtering and richer recruiter performance insights to help you manage better. As always, your feedback shapes what we build next, so tell us what you would like to see.